How to Prepare an SVG for Pen Plotting
Turn any SVG into a clean, plot-ready file: paths not fills, correct scale, layers for multi-pen color, and optimizing with vpype and Inkscape before you draw.
You made a beautiful drawing on screen, sent it to the plotter, and got back a tiny scribble in the corner — or an outline where you expected a solid shape. Almost every plotting headache traces back to the SVG, not the machine. A pen plotter is brutally literal: it draws exactly the paths in your file, at exactly the scale they claim to be, in exactly the order they appear. Get the file right and the hardware just works.
This guide walks through what “plot-ready” actually means and how to get there with two free tools: Inkscape for hands-on editing and vpype for command-line cleanup.
What makes an SVG plot-ready
A plotter follows the centerline of each path. It does not understand fills, gradients, opacity, blur, or stroke width. Keep three things in mind:
- Paths, not strokes-as-fills. Your art must exist as actual vector paths. A 4 mm-thick stroke isn’t a fat line to a plotter — its outline gets traced as two thin lines on either side. If you want a single confident stroke, reduce it to a centerline. If you genuinely want a thick mark, that comes from pen choice, not stroke width.
- Lines vs. fills. A filled rectangle plots as a hollow box. To get solid color you must generate hatching — parallel or crosshatched lines inside the shape — before plotting. There’s no shortcut; the pen can only draw lines.
- No invisible junk. Hidden layers, zero-length paths, duplicate objects stacked on top of each other, and clipped-but-still-present geometry all get drawn or slow things down. Clean them out.
Units, scale, and page size
This is where most beginners lose an afternoon. Set your SVG document to millimeters and size it to your actual paper — say 297 × 420 mm for A3. Critically, make sure 1 user unit = 1 mm. SVGs that were exported assuming 96 pixels per inch will plot at the wrong size unless your software rescales them. When in doubt, draw a 100 mm test square, plot just that, and measure it with a ruler before committing to a full piece.
Cleaning and optimizing with vpype
vpype is the workhorse of plotter prep — a command-line pipeline built specifically for vector art bound for pens. You chain commands left to right. A typical first pass:
vpype read drawing.svg linemerge linesort reloop linesimplify 0.1mm write clean.svgHere’s what each step earns you:
linemergejoins path segments whose endpoints nearly touch into single continuous lines. Fewer pen-ups means a faster plot and no visible seam where two segments met.linesortreorders paths to minimize wasted travel between them. On a dense drawing this can cut plot time dramatically — the pen stops zig-zagging across the page between marks.relooprandomizes where closed loops start, so the tiny overlap dot at a loop’s start/end isn’t always in the same place. Less visually obvious seams.linesimplifydrops redundant points within a tolerance, shrinking bloated files exported from design tools without changing how the line looks.
Add scaleto 297mm 420mm to force a known page size, or layout a3 to center everything on a standard sheet with margins. Always show the result (vpype read clean.svg show) to preview before you plot.
Editing in Inkscape
Inkscape handles the things that need a human eye:
- Object to Path (
Path > Object to Path) converts text and shapes into editable paths so nothing depends on fonts being installed. - Stroke to Path turns a thick stroke into a filled outline — useful when you do want that shape, dangerous when you forget it doubles your lines.
- Document Properties is where you lock down page size and units.
- The XML editor lets you delete stray attributes and confirm what’s really in the file.
For multi-color work, Inkscape’s free plotting extensions (such as the AxiDraw or generic G-code extensions) can drive the machine directly, pausing between layers.
Layers for multi-pen color
Each pen color lives on its own layer. Plot one layer, pause, swap the pen, plot the next. The trick that saves you: keep registration intact by never moving the paper between layers — tape it down once and leave it. In vpype, separate colors become separate layers you can write out individually, or plot in sequence with a pause command. Name layers clearly (“black-fineliner”, “red-gel”) so future-you knows the swap order.
Generating G-code or using a plotting extension
You have two routes from clean SVG to motion:
- Plotting extension / direct driver. Tools like the AxiDraw extension (which the iDraw and many AxiDraw-class machines use) or
vpype-gcodetalk to the machine and handle pen-up/pen-down for you. Easiest for most people. - Generate G-code, then stream it. For GRBL-based DIY machines, convert the SVG to G-code (via
vpype-gcodeor a dedicated tool) and stream it with a sender. This gives you control over feed rates and pen-lift servo positions but expects you to tune them.
Either way, do a dry run with the pen up first to confirm the travel stays on the page.
Common pitfalls
- Tiny or oversized output — units/scale mismatch. Test-square it.
- Outlines instead of solids — you forgot to hatch the fills.
- Doubled lines — duplicate paths or an unconverted thick stroke.
- Glacial plot times — skipped
linesort; the pen is traveling miles between marks. - Off-page disasters — geometry living outside the document bounds you couldn’t see on screen.
Prep is 90% of a clean plot. Once your pipeline is dialed in, browse the best pens and best paper to make those clean paths look their best on the page.
Frequently asked questions
Why does my plotter draw outlines instead of solid shapes?
A plotter only follows the centerline of each path — it cannot fill an area the way a screen does. A filled shape plots as just its outline. To get solid color you have to generate hatching or crosshatch paths inside the shape first, usually with vpype's fill or a hatch extension.
Do I need to convert text and strokes to paths?
Yes. Convert text to paths so the plotter doesn't depend on fonts, and convert thick strokes to their centerline if you want a single pen line rather than the outline of a fat stroke. In Inkscape, use Path > Object to Path and Path > Stroke to Path as needed.
What units and document size should my SVG use?
Set the document to real-world millimeters at the exact size of your paper, and make sure 1 user unit maps to 1 mm. Mismatched units are the number one reason a drawing comes out tiny or runs off the bed.
What does vpype linemerge actually do?
It joins separate path segments whose endpoints nearly touch into single continuous lines, so the pen lifts far less often. Fewer pen-ups means faster plots and cleaner joins where segments used to meet.
Gear mentioned in this guide
Daniel Shiffman The Nature of Code
4.8 (900)The book that teaches the generative-systems thinking behind great plotter art — flow fields, forces, noise and autonomous agents, all in approachable code.
Best for: Learning to generate art worth plotting
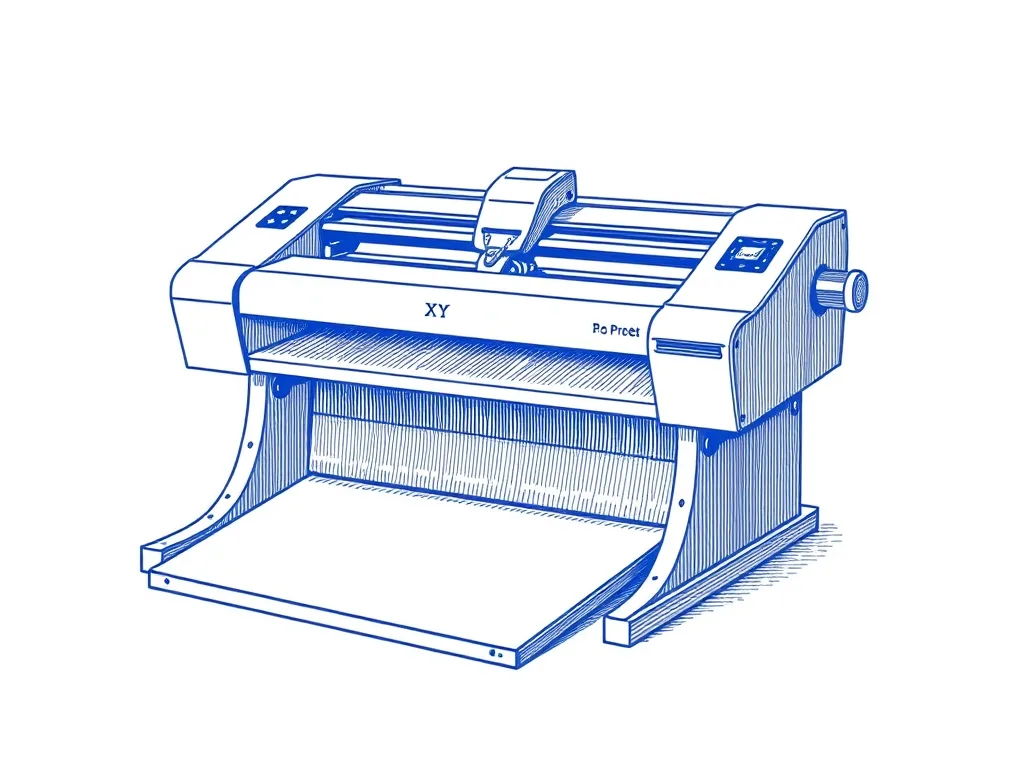
UUNA TEK iDraw 2.0 A3 Pen Plotter
4.3 (218)A large-format desktop XY plotter that draws on paper up to A3 — the most accessible on-ramp to AxiDraw-style plotting without the AxiDraw price.
Best for: Makers who want A3 plots out of the box